Qualitywatch
A Nuffield Trust and Health Foundation programme
NHS performance tracker
Our monthly-updated analysis of the NHS's performance against totemic access and waiting times targets.
Headlines
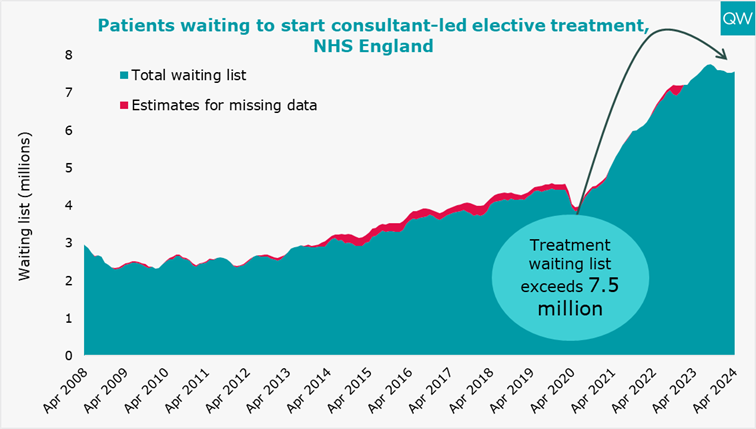
In April 2024, the overall waiting list to start elective (planned) care increased slightly by nearly 34,000 compared to March, standing at 7.57 million.
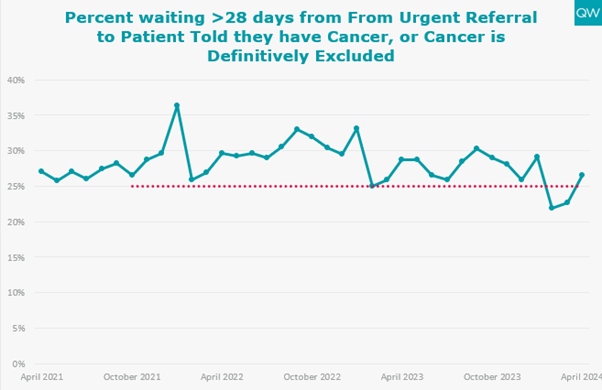
In April 2024, 73.5% of patients had their cancer diagnosis confirmed within 28 days, which is just under the 75% standard that should have been met. This still leaves over 70,000 patients who waited longer than 28 days for their diagnosis to be ratified.
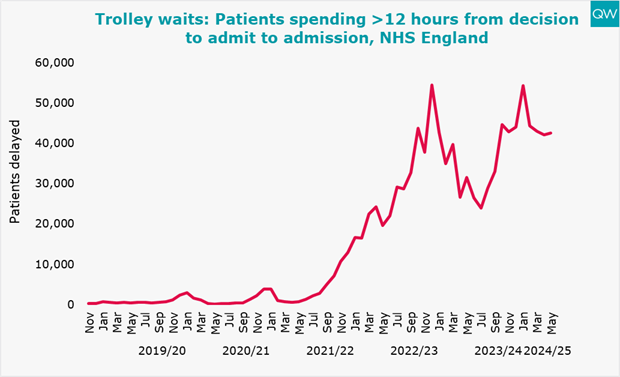
In May 2024, over 42,000 trolley waits of over 12 hours took place, 100 times more than the same month five years ago, before the pandemic.
The analysis below includes the latest data on key activity and performance measures from April and May 2024, as published by NHS England on 13 June 2024. This includes data on the NHS's performance against some key targets, including some of those set out in the latest planning guidance, as well as other indicators of patient safety and care.
Planned hospital care and diagnostic test waiting times
- The waiting list to start elective (planned) care has increased by approximately 34,000 in the last month, from 7.54 million in March 2024 to 7.57 million in April 2024.
- 6.33 million people were waiting to start elective care in April 2024. This is lower than the overall waiting list of 7.57 million because some people are waiting for multiple treatments.
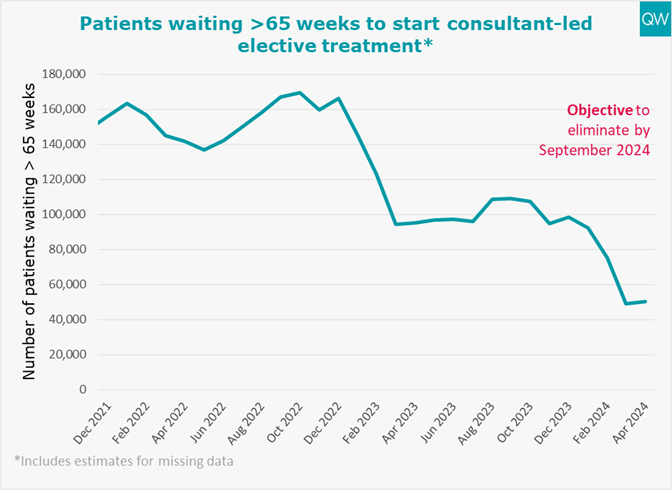
- There is a revised objective to have no more people waiting over 65 weeks to start consultant-led elective treatment by September 2024 (except where patients choose to wait longer), replacing the original objective for this to happen by March 2024. There were 50,000 waits this long in April 2024, the second lowest figure since this metric began three years back in April 2021.
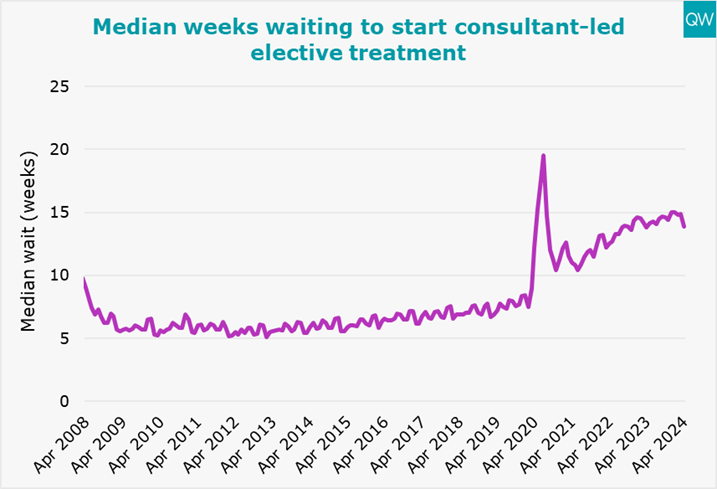
- The median time that patients had been on the waiting list was 13.9 weeks in April 2024. This is the lowest it has been in the last eleven months, but still nearly double what it was before the pandemic in April 2019 (7.2 weeks).
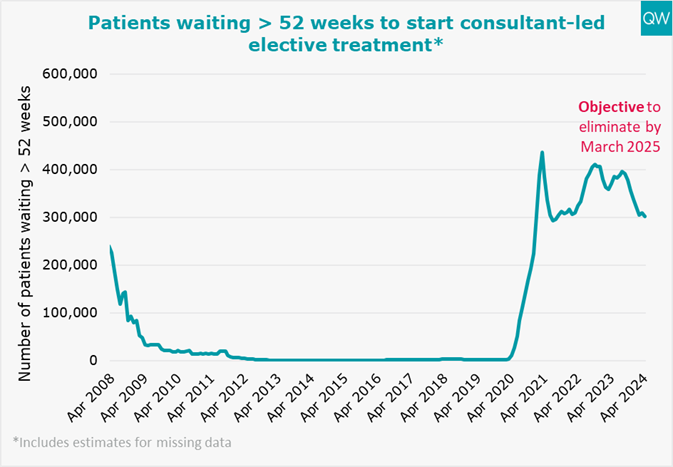
- The number of waits of over 52 weeks to start elective care stood at over 302,000 in April 2024 – the lowest it has been in the last two years. In April 2019, there were only 1,270 waits of over 52 weeks. The aim is to have nobody having to wait this long by March 2025.
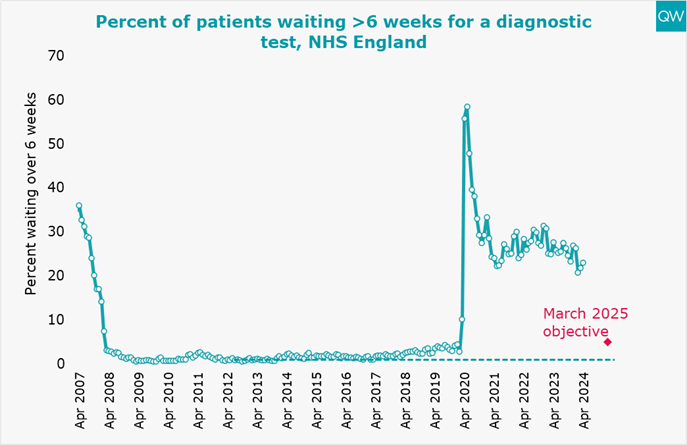
- 23% of people waited over six weeks for a diagnostic test in April 2024. This is a slight increase on the previous month, and is far beyond the 1% target, as well as the objective of 5% by March 2025.
For more information, see our treatment waiting times and diagnostic test waiting times indicators. For information on the recategorisation of community service pathways, see the NHS statistical press notice.
Cancer waiting times
- Once again, the NHS is missing its target to have 75% patients having their cancer diagnosed or ruled out within 28 days. In April 2024, 70,302 patients waited longer than this time, which is 11,796 more people compared to the previous month, when the target was met.
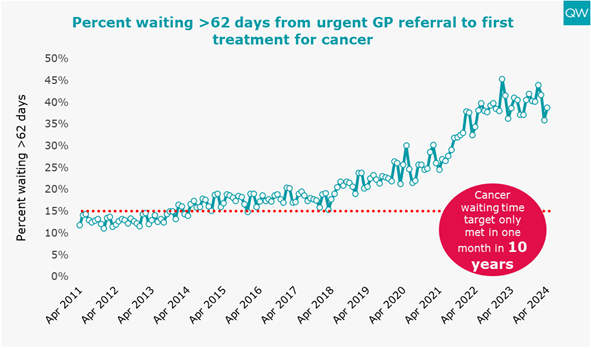
- In April 2024, 39% of patients who had their first treatment for cancer following an urgent GP referral waited longer than two months. It is still far away from the target of only 15% of patients waiting this long, which has only been met once since April 2014.
- The number of patients who waited longer than two months from an urgent GP referral to a first treatment for cancer was 6,226 in April 2024. When the 15% threshold target was last met in December 2015, only 1,704 patients waited more than two months for their first cancer treatment.
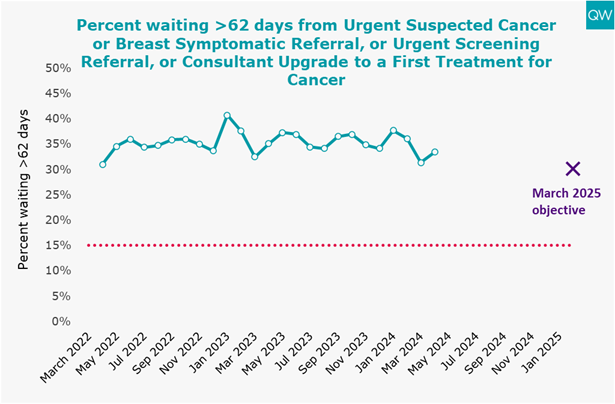
- In December, NHS England began publishing new cancer waiting time standards. For the new standard concerning two-month waits from an urgent suspected cancer referral, or breast symptomatic referral, or urgent screening referral, or consultant upgrade to a first treatment for cancer, 33% waited longer than the target time to begin treatment in April 2024. This is up from March 2024 moving performance away from the new objective of reducing this proportion to 30% by March 2025. The 15% standard has not come close to being met during the period for which records are available.
For more information, see our cancer waiting time targets indicator. Data for the first cancer chart from April 2023 onwards has been derived from NHS England’s commissioner-based cancer waiting times data extract. This is due to changes in the cancer waiting times standards which have led to changes in the published national-level data.
Emergency care
A&E
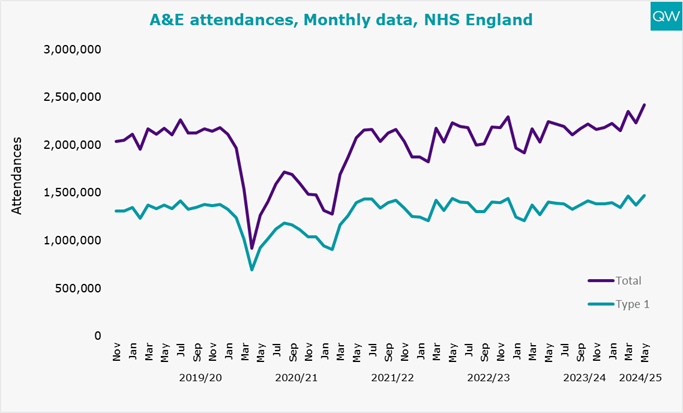
- In May 2024, there were 2.42 million total attendances to A&E departments, the highest number of attendances on record (since 2010/11) for the month of May. This represents an 8% increase compared to the previous May, an 11% increase compared to before the pandemic in May 2019, and a 29% increase on the first recorded May in 2011, when there were only 1.87 million attendances.
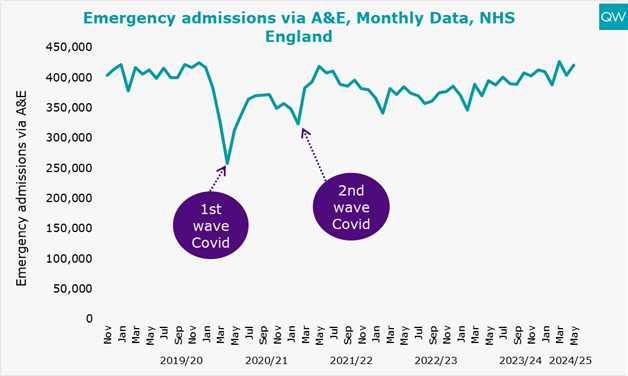
- There was also a relatively high number of emergency admissions via A&E, reaching 420,204 in May 2024. This is 6.4% higher than in May 2023 but only 1.8% higher than admissions via A&E seen in the pre-pandemic period in May 2019 (412,841).
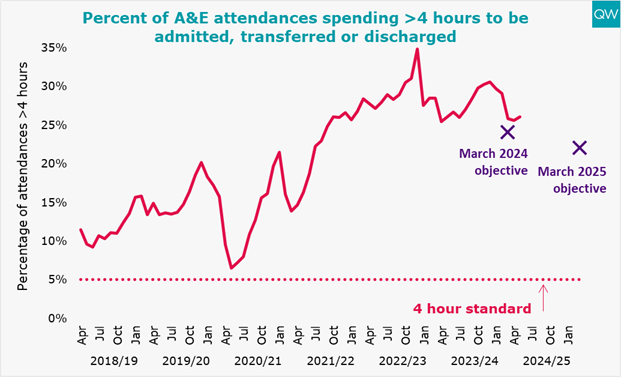
- A little over a quarter (26%) of people attending A&E spent more than four hours from arrival to admission, transfer or discharge in May 2024. This is the same as May last year, but 12.7 percentage points worse than before the pandemic in May 2019. · Although close, performance against the four-hour target is yet to meet the March 2024 objective of 76% or fewer being seen within the target time. The long-standing 95% standard is irrefutably far from reach.
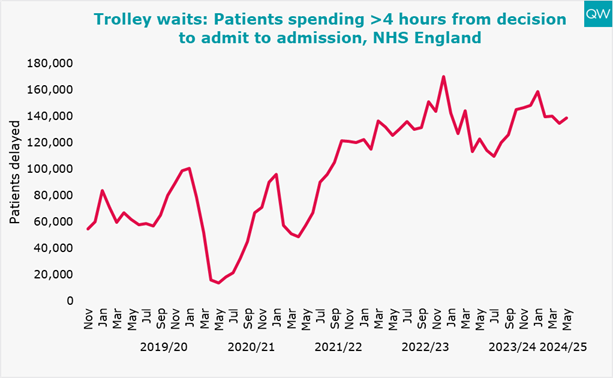
- Trolley waits (the time between a decision to admit a patient and them being admitted) of over four hours increased to nearly 139,000 in May 2024, compared to the previous month. This is 13% more than in May last year and more than double the number in May 2019 when there were about 61,507 instances of waits this long.
- There were 42,555 trolley waits of over 12 hours in May 2024 - that’s nearly 11,000 more than May 2023, a 35% increase. It’s also 100 times more than before the pandemic when there were only 416 trolley waits over that length of time in May 2019.
For more information, see our A&E waiting times indicator.
Ambulances
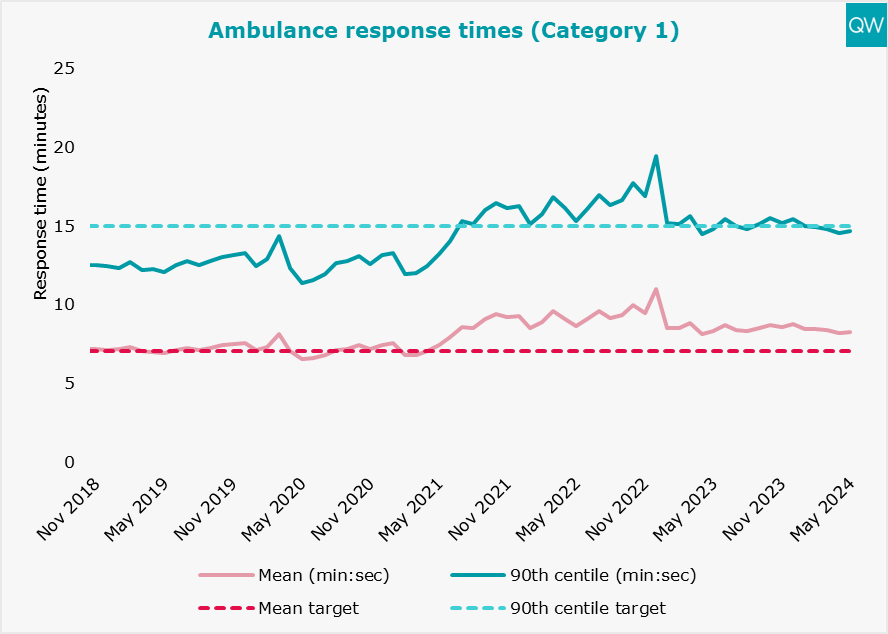
- In May 2024, there was an average response time of 8 minutes 16 seconds to Category 1 incidents (life-threatening conditions, such as cardiac or respiratory arrest), 11 seconds faster than the average over the last 12 months. The seven-minute mean target remains out of reach.
- One in 10 people with a Category 1 incident waited over 14 minutes 41 seconds, within the target which states that 90% of patients with a Category 1 incident should be seen in under 15 minutes.
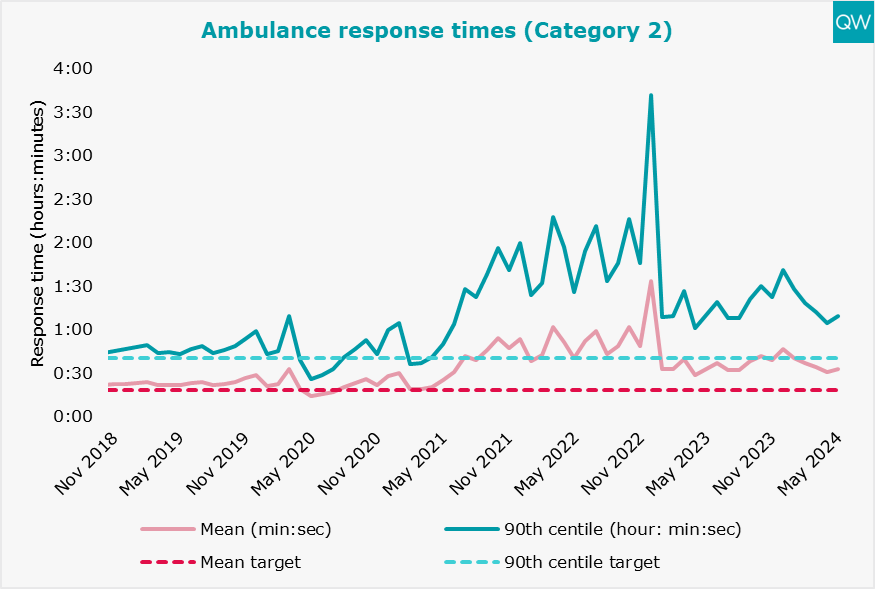
- Response times to Category 2 incidents (emergency conditions such as stroke or heart attack) were 32 minutes 44 seconds, 22 seconds more than performance last May. This is still far from the mean target of 18 minutes.
For more information, see our ambulance response times indicator.
About this data
QualityWatch provides independent scrutiny of the health and social care system. The most recent data published today reflects changes in access and waiting times in the aftermath of the pandemic.
Between May 2019 and May 2023, in response to proposals made in the Clinically-Led Review of NHS Access Standards Interim Report, 14 hospital trusts acted as field testing sites for alternatives to the existing four-hour A&E standard. During this period, these trusts did not report performance on the four-hour standard and are hence absent from the data for May 2019 to May 2023. Reporting on the findings of the Clinical Review of Standards for Urgent and Emergency Care is now available.
For interactive charts showing the quality of health and social care over time, please refer to our 200+ indicators.